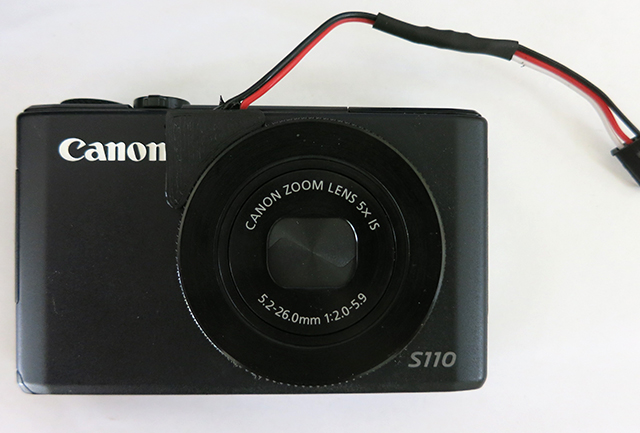
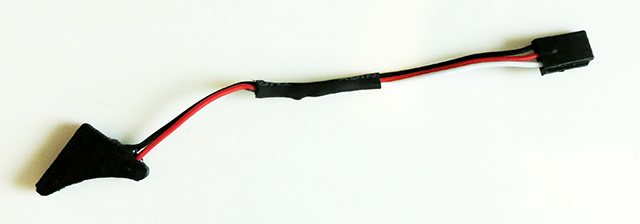
You can improve the accuracy of your geotags and
you are less likely to encounter mismatches between your Pixhawk log file
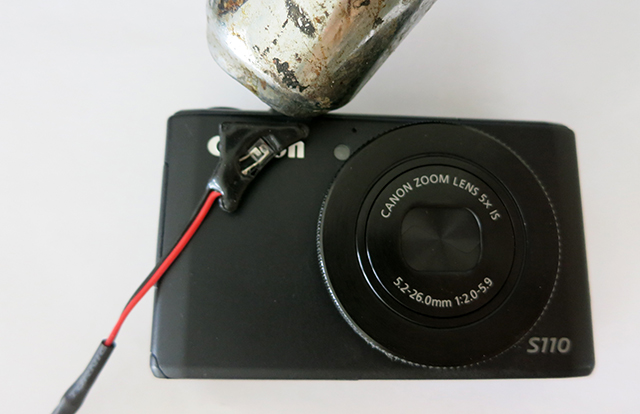
and number of images taken if you install a precision geotag cable. The
cable contains a phototransistor that picks up a red eye reduction LED
flash when your camera takes a picture. The LED flashes exactly and only
when the shutter opens. This corrects shutter lag, missed photos, or
extra photos. Do the following to install and configure your Tuffwing
precise geotag cable, CHDK enabled Canon point and shoot camera, and
Pixhawk autopilot.
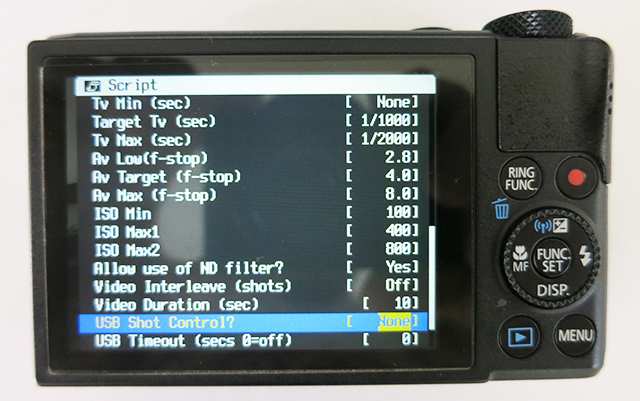
Set USB Shot Control to None.
Set it back to Pixhawk after you verify your red eye
reduction LED is properly flashing.
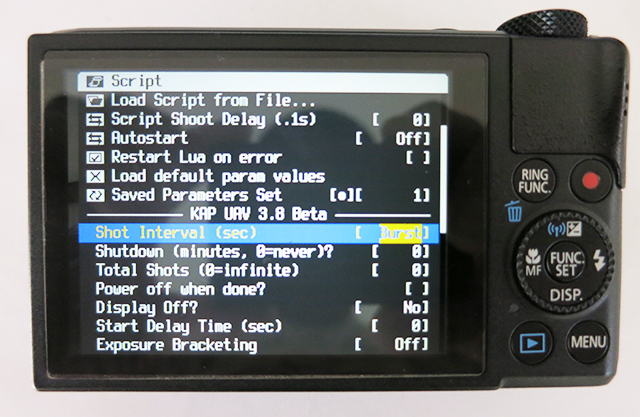
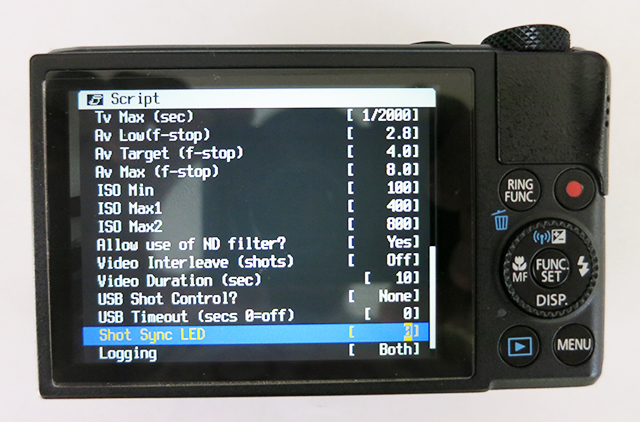
Set Shot Sync LED to 0.
Note, this works for Canon S110s. You may need to choose a
different number for your camera.
Press the
MENU button to exit the script editor, then 1/2
press the Shutter button to start the script.
Your red eye reduction LED should flash like the video. If
it doesn't, then change Shot Sync LED to 1,
then 2, etc.
If your red eye reduction LED won't flash like the video, then
your camera will not work with the cable.
Each time you camera takes a picture your
Pixhawk records a CAM event in the log file. It looks like this:
CAM
321916644
515572200
1893
29.88722
-98.8196
573.64
100.22
564.3
-28.47
7.85
74.09
If CAM_FEEDBACK_PIN is set to -1 (disabled), then each time
the Pixhawk triggers the camera a CAM event is recorded.
However, if CAM_FEEDBACK_PIN is set to to 50-55(enabled), then a TRIG event will
be recorded each time the Pixhawk triggers the camera and a CAM event
will be recorded each time a feedback signal is received by the Pixhawk. Geotagging programs still work the same way - with CAM events in the log
file. The TRIG events are useful for troubleshooting. Do the following
to verify you're properly logging CAM and TRIG events:
Open your log file with Excel. Choose comma
delimited.
Sort the data by Column A.
Find all CAM events, copy them, then paste into a new worksheet.
Find all TRIG events. copy them, then past into the same new
worksheet.
Sort the data by Column C. This is GPS time in milliseconds.
A
B
GPS Time in Milliseconds
lat
long
alt
TRIG
314478180
515564800
1893
29.88832
-98.8201
576.27
102.85
566.79
0.99
2.36
175.88
TRIG
315478238
515565800
1893
29.88813
-98.8201
575.28
101.86
565.99
-4.01
2.59
175.05
CAM
321916644
515572200
1893
29.88722
-98.8196
573.64
100.22
564.3
-28.47
7.85
74.09
CAM
327315518
515577600
1893
29.88764
-98.8191
573.74
100.32
564.93
-7.06
5.13
358.09
TRIG
332078554
515582400
1893
29.88809
-98.8192
573.51
100.09
565.9
5.11
4.19
359.23
CAM
333097187
515583400
1893
29.88818
-98.8192
572.66
99.24
565.1
4.52
4.98
2.1
TRIG
334078609
515584400
1893
29.88828
-98.8192
572.77
99.35
565.03
1.52
8.7
6.26
CAM
334356899
515584600
1893
29.8883
-98.8192
572.92
99.5
565.13
4.52
10.2
5.79
TRIG
336078350
515586400
1893
29.88846
-98.8192
574.23
100.81
566.35
-2.11
7.49
4.72
CAM
336356375
515586600
1893
29.88848
-98.8192
574.33
100.91
566.48
-2.24
9.02
4.61
TRIG
338078436
515588400
1893
29.88863
-98.8191
574.54
101.12
566.96
-1.37
5.25
0.37
CAM
338356182
515588600
1893
29.88865
-98.8191
574.49
101.07
567.02
-1.38
5.65
1.82
TRIG
340078440
515590400
1893
29.88881
-98.8191
573.23
99.81
566.32
-6.36
5.69
2.36
In the data above, the camera was triggered twice before a picture
was taken, then two pictures before the next TRIG. This is caused by
the lag of the first picture.
Clean TRIG followed by CAM after the initial lag.
Use Excel to count the number of CAM messages to compare to the
number of photos taken.
Geotag your images and enjoy the tightest blue and green dots you've
ever seen.